
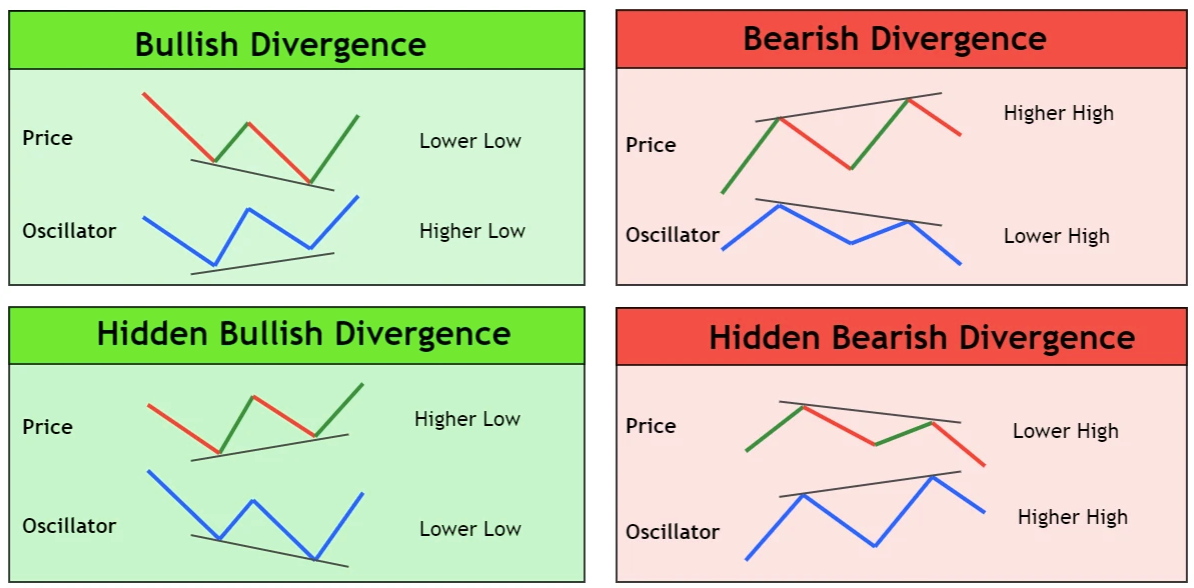
In technical analysis, divergence refers to a situation in which the price of an asset and a technical indicator, such as a moving average or an oscillator, are moving in opposite directions. Divergence can be either bullish divergence, in which the price is moving down while the indicator is moving up, or bearish divergence, in which the price is moving up while the indicator is moving down.
Technical analysts use divergence as a way to identify potential reversals in the trend. For example, if an asset's price is rising, but the indicator is falling, it could be a sign that the trend is losing momentum and may be about to reverse. Conversely, if the price is falling, but the indicator is rising, it could be a sign that the trend is about to change direction.
There are several ways to use divergence in technical analysis, including:
Moving averages: A moving average is a statistical measure that smooths out price data over a specified time period. Technical analysts may use moving averages to identify divergence by looking for a crossover, in which the price moves from one side of the moving average to the other.
Oscillators: Oscillators are technical indicators that fluctuate between two extreme values and are used to identify overbought and oversold conditions. Technical analysts may use oscillators to identify divergence by looking for a divergence between the oscillator and the price.
Trend lines: A trend line is a straight line that connects two or more points on a chart and is used to identify trends. Technical analysts may use trend lines to identify divergence by looking for a break, in which the price moves through the trend line.
Divergence analysis is just one tool in the technical analyst's toolkit, and it should be used in conjunction with other techniques, such as trend analysis and support and resistance analysis, to make informed predictions about price movements in the market.