
Continuation Patterns

In technical analysis, a continuation pattern is a chart pattern that reflects a pause in trend, rather than a reversal. These patterns indicate that the trend is likely to continue once the pattern is complete. Some common continuation patterns include triangles, flags, and rectangles.
Triangles: There are three types of triangles: symmetrical, ascending, and descending. A symmetrical triangle forms when the price action is converging towards a point, creating a triangle shape on the chart. An ascending triangle forms when the price is restricted by a flat resistance level and a rising support level. A descending triangle forms when the price is restricted by a falling support level and a flat resistance level.
Flags: A flag is a small chart pattern that appears after a sharp price move. It looks like a rectangle or parallelogram and usually slopes against the trend of the preceding price move.
Rectangles: A rectangle is a chart pattern that is characterized by horizontal support and resistance levels. The price bounces between these levels, creating a rectangular shape on the chart.
It's important to note that these patterns are most reliable when they appear in the direction of the overall trend. For example, if the market is in an uptrend, continuation patterns that form during that uptrend are more likely to result in an continuation of the uptrend once the pattern is complete.

Symmetrical Triangle
A symmetrical triangle is a chart pattern that is characterized by converging trendlines, creating a triangle shape on the chart. The trendlines are drawn by connecting a series of higher lows and lower highs. This pattern typically appears during a period of consolidation, where the price is paused or moving sideways.
The symmetrical triangle pattern is considered to be a neutral pattern, as it does not provide any clear indication of the direction in which the price is likely to move once the pattern is complete. However, a breakout from this pattern is often seen as a strong indicator of the direction of the next trend. If the price breaks out above the upper trendline, it is considered a bullish signal and suggests that the price is likely to continue moving higher. On the other hand, if the price breaks out below the lower trendline, it is considered a bearish signal and suggests that the price is likely to continue moving lower.
It's important to note that the symmetrical triangle pattern is a continuation pattern, which means that it is most reliable when it appears in the direction of the overall trend. For example, if the market is in an uptrend and a symmetrical triangle forms during that uptrend, it is more likely to result in a continuation of the uptrend once the pattern is complete.
Ascending Triangle
An ascending triangle is a chart pattern that is characterized by a flat resistance level and a rising support level. This pattern typically appears during an uptrend and is considered to be a bullish pattern.
The flat resistance level represents a price level at which sellers have consistently been able to enter the market and push the price down. As buyers continue to push the price higher, the support level rises. The combination of a flat resistance level and a rising support level creates a triangle shape on the chart.
A breakout from the ascending triangle pattern is often seen as a strong bullish signal. If the price breaks out above the resistance level, it suggests that the uptrend is likely to continue. On the other hand, if the price fails to break out above the resistance level and instead falls back below the support level, it could be a bearish signal and suggest that the uptrend has ended.
It's important to note that the ascending triangle pattern is a continuation pattern, which means that it is most reliable when it appears in the direction of the overall trend. For example, if the market is in an uptrend and an ascending triangle forms during that uptrend, it is more likely to result in a continuation of the uptrend once the pattern is complete.
Descending Triangle
A descending triangle is a chart pattern that is characterized by a falling support level and a flat resistance level. This pattern typically appears during a downtrend and is considered to be a bearish pattern.
The flat resistance level represents a price level at which buyers have consistently been able to enter the market and push the price up. As sellers continue to push the price lower, the support level falls. The combination of a falling support level and a flat resistance level creates a triangle shape on the chart.
A breakout from the descending triangle pattern is often seen as a strong bearish signal. If the price breaks out below the support level, it suggests that the downtrend is likely to continue. On the other hand, if the price fails to break out below the support level and instead rises back above the resistance level, it could be a bullish signal and suggest that the downtrend has ended.
It's important to note that the descending triangle pattern is a continuation pattern, which means that it is most reliable when it appears in the direction of the overall trend. For example, if the market is in a downtrend and a descending triangle forms during that downtrend, it is more likely to result in a continuation of the downtrend once the pattern is complete.
Flag
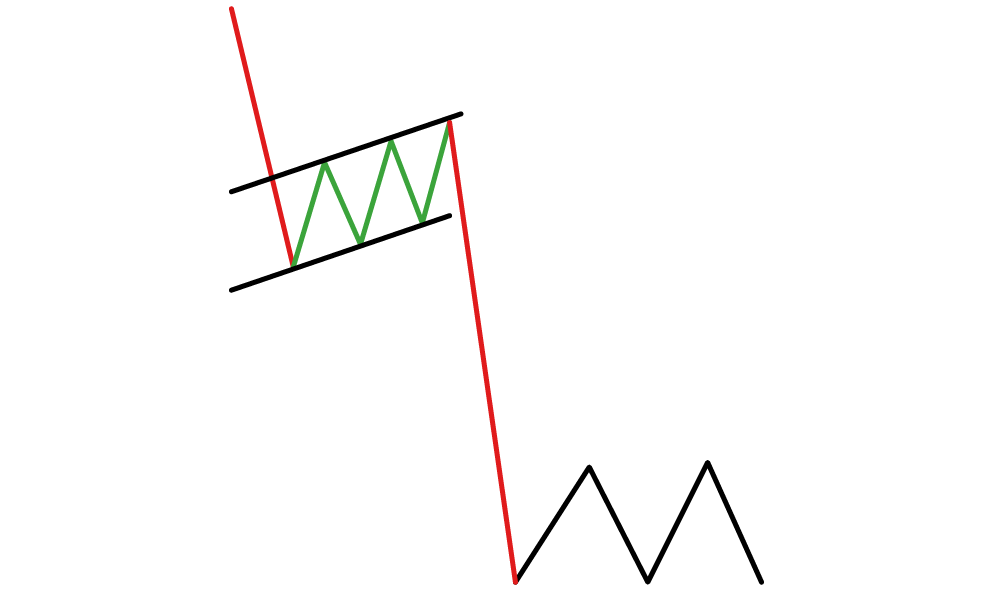
A flag is a chart pattern that appears after a sharp price move and looks like a small rectangle or parallelogram on the chart. It usually slopes against the trend of the preceding price move and is considered to be a continuation pattern.
The flag pattern is formed when the price consolidates and moves sideways within a well-defined range, forming a rectangle or parallelogram shape on the chart. This pattern is typically seen as a pause or a "breather" in the trend, rather than a reversal.
A breakout from the flag pattern is often seen as a strong indicator of the direction of the next trend. If the price breaks out in the same direction as the preceding trend, it is considered a continuation of that trend. For example, if the market is in an uptrend and a flag pattern forms during that uptrend, a breakout above the upper trendline of the flag pattern would be considered a bullish signal and suggest that the uptrend is likely to continue. On the other hand, if the price breaks out in the opposite direction of the preceding trend, it could be a reversal signal.
It's important to note that the flag pattern is a continuation pattern, which means that it is most reliable when it appears in the direction of the overall trend. For example, if the market is in an uptrend and a flag pattern forms during that uptrend, it is more likely to result in a continuation of the uptrend once the pattern is complete.
Rectangles
A rectangle is a chart pattern that is characterized by horizontal support and resistance levels. The price bounces between these levels, creating a rectangular shape on the chart. This pattern typically appears during a period of consolidation, where the price is paused or moving sideways.
The rectangle pattern is considered to be a neutral pattern, as it does not provide any clear indication of the direction in which the price is likely to move once the pattern is complete. However, a breakout from this pattern is often seen as a strong indicator of the direction of the next trend. If the price breaks out above the upper trendline, it is considered a bullish signal and suggests that the price is likely to continue moving higher. On the other hand, if the price breaks out below the lower trendline, it is considered a bearish signal and suggests that the price is likely to continue moving lower.
It's important to note that the rectangle pattern is a continuation pattern, which means that it is most reliable when it appears in the direction of the overall trend. For example, if the market is in an uptrend and a rectangle pattern forms during that uptrend, it is more likely to result in a continuation of the uptrend once the pattern is complete.
Price Channel

A price channel is a chart pattern that is formed by drawing two parallel lines on a chart. One line is drawn above the price action and the other is drawn below it. These lines create an "envelope" around the price action and define the upper and lower bounds of the channel.
The price channel pattern can be either bullish or bearish, depending on the direction of the trend. If the price is trending upwards and the channel is angled upwards, it is considered a bullish price channel. If the price is trending downwards and the channel is angled downwards, it is considered a bearish price channel.
The price channel pattern is typically seen as a continuation pattern, which means that it is most reliable when it appears in the direction of the overall trend. For example, if the market is in an uptrend and a bullish price channel forms during that uptrend, it is more likely to result in a continuation of the uptrend once the pattern is complete. Similarly, if the market is in a downtrend and a bearish price channel forms during that downtrend, it is more likely to result in a continuation of the downtrend once the pattern is complete.
A breakout from the price channel pattern is often seen as a strong indicator of the direction of the next trend. If the price breaks out above the upper trendline, it is considered a bullish signal and suggests that the price is likely to continue moving higher. On the other hand, if the price breaks out below the lower trendline, it is considered a bearish signal and suggests that the price is likely to continue moving lower.
Cup and Handle
.png)
The cup and handle pattern is a bullish chart pattern that is formed when the price action creates a "U" shape, or cup, on the chart, followed by a smaller downward move, or handle. The pattern gets its name from the shape that it forms on the chart, which looks like a cup with a handle.
The cup portion of the pattern is formed when the price consolidates and moves sideways, creating a "U" shape on the chart. This is typically seen as a period of accumulation, where buyers are entering the market and building positions. The handle portion of the pattern is formed when the price moves downward and consolidates further, creating a short-term downward trend. This is typically seen as a period of distribution, where sellers are entering the market and taking profits.
The cup and handle pattern is considered to be a bullish pattern, as it is typically seen as a reversal of a downtrend. The pattern is considered complete when the price breaks out above the resistance level, or "rim" of the cup. This breakout is often seen as a strong bullish signal and suggests that the price is likely to continue moving higher.
It's important to note that the cup and handle pattern is a reversal pattern, which means that it is most reliable when it appears at the end of a downtrend. For example, if the market is in a downtrend and a cup and handle pattern forms during that downtrend, it is more likely to result in a reversal of the downtrend and the start of an uptrend once the pattern is complete.