
Accumulation / Distribution (A/D) Indicator
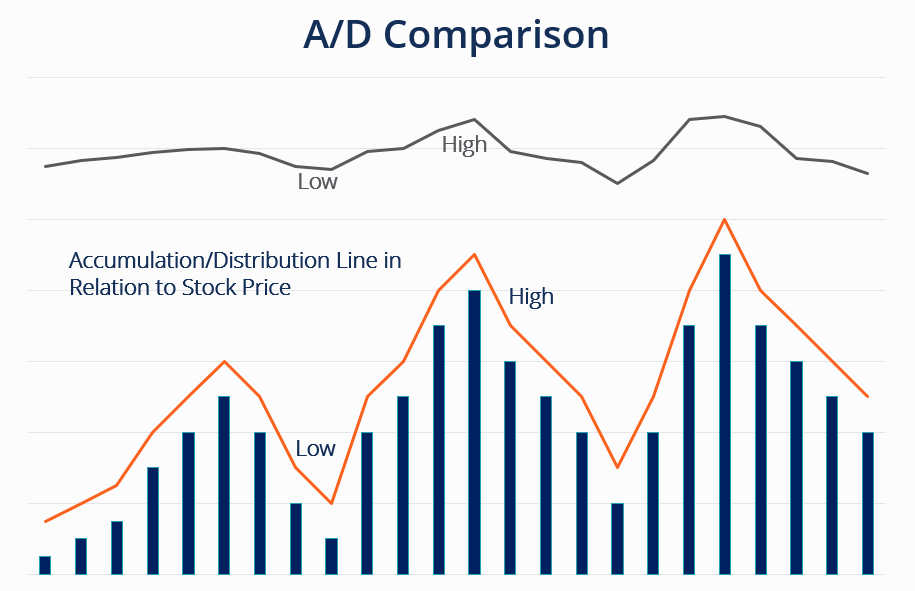
The Accumulation/Distribution (A/D) indicator is a momentum indicator that uses volume and price to identify potential buying and selling pressure. It is based on the idea that if the price is rising but volume is decreasing, it could be a sign that the uptrend is losing momentum and a trend reversal is imminent. Conversely, if the price is falling but volume is increasing, it could be a sign that the downtrend is losing momentum and a trend reversal is imminent.
The A/D indicator is calculated by subtracting the close of the previous period from the current close, then adding or subtracting this result to a cumulative total. If the current close is higher than the previous close, the A/D indicator increases by the amount of the difference. If the current close is lower than the previous close, the A/D indicator decreases by the amount of the difference.
Traders often use the A/D indicator to confirm price trends or to identify potential trend reversals. If the A/D indicator is trending higher while the price is also trending higher, it can be seen as confirmation that the uptrend is strong. On the other hand, if the A/D indicator is trending lower while the price is trending higher, it may be a sign that the uptrend is losing momentum and could potentially reverse.
It's important to note that the A/D indicator is a lagging indicator, meaning that it is based on historical data and may not necessarily be a reliable predictor of future price movements. As with any technical indicator, it is best to use the A/D indicator in conjunction with other forms of analysis, such as chart patterns, trend lines, and fundamental analysis.
How to use Accumulation / Distribution (A/D) Indicator
To use the Accumulation/Distribution (A/D) indicator, follow these steps:
- Plot the A/D line on a chart alongside the price of the security.
- Use the A/D line to confirm price trends. If the A/D line is trending higher while the price is also trending higher, it can be seen as confirmation that the uptrend is strong. On the other hand, if the A/D line is trending lower while the price is trending higher, it may be a sign that the uptrend is losing momentum and could potentially reverse.
- Look for divergences between the A/D line and price. A divergence occurs when the A/D line and price are moving in opposite directions. For example, if the price is making higher highs but the A/D line is making lower highs, it could be a sign that the uptrend is losing momentum and a trend reversal is imminent.
- Use the A/D line to identify potential breakout points. If the A/D line is trending higher and breaks through a resistance level, it could be a sign that the price is also likely to break through that resistance level.
It's important to note that the A/D indicator is a lagging indicator, meaning that it is based on historical data and may not necessarily be a reliable predictor of future price movements. As with any technical indicator, it is best to use the A/D indicator in conjunction with other forms of analysis, such as chart patterns, trend lines, and fundamental analysis.