
Bollinger Bands Indicator
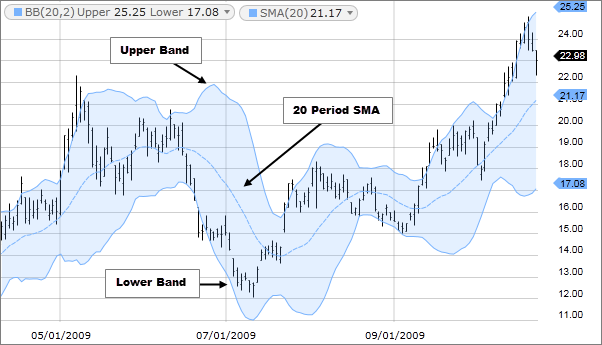
Bollinger Bands are a type of technical indicator that are used to measure the volatility of a security. They consist of a simple moving average (SMA) and two upper and lower bands that are placed a certain number of standard deviations above and below the SMA. The bands adjust to changes in volatility, widening during periods of high volatility and contracting during periods of low volatility.
Traders often use Bollinger Bands to identify overbought and oversold conditions in the market, as well as potential trend reversals. When the price of a security is trading near the upper band, it is considered overbought and may be due for a pullback. Conversely, when the price is trading near the lower band, it is considered oversold and may be due for a rally. A trader might buy when the price touches the lower band, or sell when the price touches the upper band.
Bollinger Bands can also be used to identify potential breakouts. If the price breaks through the upper band, it may indicate a continuation of the uptrend. On the other hand, if the price breaks through the lower band, it may indicate a continuation of the downtrend.
It's important to note that Bollinger Bands are a lagging indicator, meaning that they are based on historical data and may not necessarily be a reliable predictor of future price movements. As with any technical indicator, it is best to use Bollinger Bands in conjunction with other forms of analysis, such as chart patterns, trend lines, and fundamental analysis.
How to use Bollinger Bands Indicator
To use Bollinger Bands, follow these steps:
- Choose a time period for the calculation of the indicator. A shorter time period will make the bands more sensitive, while a longer time period will make them less sensitive.
- Choose a number of standard deviations to use for the calculation of the upper and lower bands. A common choice is 2 standard deviations, but other values can be used.
- Calculate the simple moving average (SMA) for the chosen time period.
- Calculate the upper band by adding the standard deviation to the SMA.
- Calculate the lower band by subtracting the standard deviation from the SMA.
- Plot the SMA, upper band, and lower band on a chart.
- Use Bollinger Bands to identify overbought and oversold conditions in the market. When the price is trading near the upper band, it is considered overbought and may be due for a pullback. Conversely, when the price is trading near the lower band, it is considered oversold and may be due for a rally.
- Use Bollinger Bands to identify potential trend reversals. A trader might buy when the price touches the lower band, or sell when the price touches the upper band.
- Use Bollinger Bands to identify potential breakouts. If the price breaks through the upper band, it may indicate a continuation of the uptrend. On the other hand, if the price breaks through the lower band, it may indicate a continuation of the downtrend.
It's important to note that Bollinger Bands are a lagging indicator, meaning that they are based on historical data and may not necessarily be a reliable predictor of future price movements. As with any technical indicator, it is best to use Bollinger Bands in conjunction with other forms of analysis, such as chart patterns, trend lines, and fundamental analysis.