
Moving Average Convergence Divergence (MACD) Indicator
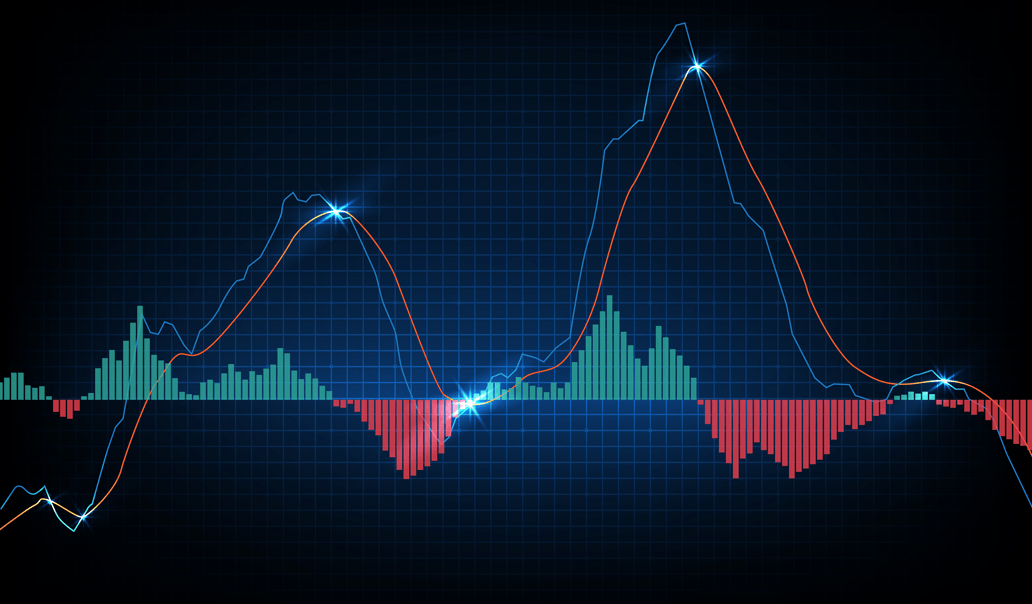
The Moving Average Convergence Divergence (MACD) is a popular technical analysis indicator used to identify trend changes in the price of a security. It is calculated by subtracting the 26-period exponential moving average (EMA) from the 12-period EMA. A nine-period EMA of the MACD, called the "signal line," is then plotted on top of the MACD to help identify buy and sell signals.
The MACD is typically displayed as a histogram, which shows the distance between the MACD line and the signal line, as well as a line chart of the MACD line. When the MACD line is above the signal line, it indicates that the price is trending upwards. When the MACD line is below the signal line, it indicates that the price is trending downwards.
To use the MACD, traders may look for crossovers between the MACD line and the signal line as trade signals. A bullish crossover occurs when the MACD line crosses above the signal line, while a bearish crossover occurs when the MACD line crosses below the signal line. Traders may also look for divergences between the MACD and the price of the security as a potential trade signal. A bullish divergence occurs when the MACD is making new highs while the price of the security is not, and a bearish divergence occurs when the MACD is making new lows while the price of the security is not.
It is important to note that the MACD is a lagging indicator, meaning that it is based on past price data and may not provide timely signals for traders. It is often used in conjunction with other technical analysis tools to confirm trade signals and provide a more complete analysis of a security.
Settings for MACD
The best setting for the Moving Average Convergence Divergence (MACD) indicator depends on the specific security and trading strategy being used. The MACD is typically calculated using the following parameters:
The number of periods for the fast moving average (12): This is the number of periods used to calculate the MACD line. A shorter time frame will result in a more sensitive MACD, while a longer time frame will result in a less sensitive MACD.
The number of periods for the slow moving average (26): This is the number of periods used to calculate the signal line. A longer time frame will result in a smoother signal line, but it may also result in fewer trade signals.
The number of periods for the moving average of the MACD (9): This is the number of periods used to calculate the moving average of the MACD, also known as the "signal line."
There is no "one size fits all" setting for the MACD, and traders may need to experiment with different settings to find the one that works best for their specific security and trading strategy. Some traders may prefer a more sensitive MACD with shorter time frames, while others may prefer a smoother MACD with longer time frames. It is also common for traders to use multiple MACD settings with different time frames to get a more complete picture of the trend.