
Rate of change (ROC)
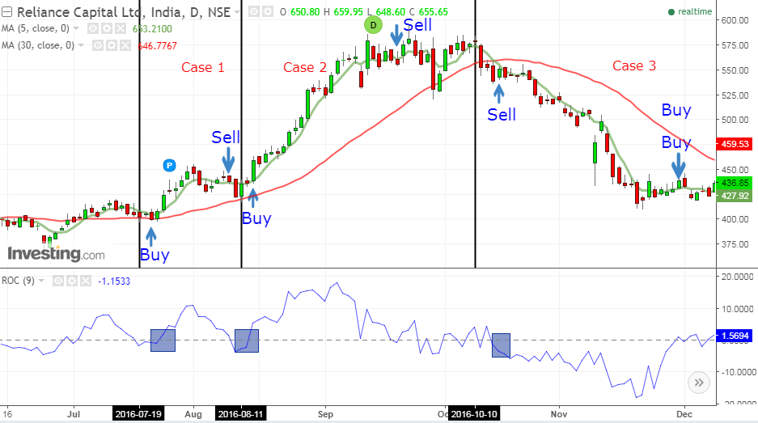
The Rate of Change (ROC) indicator is a technical analysis tool that measures the percentage change in price between the current period and a specific number of periods in the past. It is typically used to identify potential trend reversals by measuring the momentum of price changes.
The ROC indicator is plotted as a line on a chart, with the current period's price plotted against the price from a specific number of periods in the past. A positive ROC indicates that the current price is higher than the price from the specified number of periods in the past, while a negative ROC indicates that the current price is lower. The ROC can be used in conjunction with other technical indicators, such as moving averages, to confirm potential trend changes.
The ROC indicator is commonly used to identify overbought and oversold conditions in a market, as well as to confirm trend strength. It can also be used to set stop-loss orders, as a sudden change in the ROC may indicate that a trend is losing momentum and that it is time to exit a trade.
How to use ROC
To use the ROC indicator:
- Choose a time frame for the indicator. This could be anything from a few minutes to a few months, depending on your trading style and the type of market you are trading in.
- Choose the number of periods to use in the calculation. A longer time frame and a larger number of periods will result in a smoother, less sensitive ROC line, while a shorter time frame and a smaller number of periods will result in a more sensitive, more volatile ROC line.
- Plot the ROC indicator on your chart. The ROC will be plotted as a line, with the current period's price plotted against the price from the specified number of periods in the past.
- Look for potential trend reversals. A positive ROC indicates that the current price is higher than the price from the specified number of periods in the past, while a negative ROC indicates that the current price is lower. A sudden change in the ROC may indicate that a trend is losing momentum and that it is time to exit a trade.
- Confirm potential trend reversals using other technical indicators. The ROC can be used in conjunction with other indicators, such as moving averages, to confirm potential trend changes.
- Use the ROC to set stop-loss orders. A sudden change in the ROC may indicate that a trend is losing momentum and that it is time to exit a trade. You can use the ROC to set stop-loss orders to protect your profits and minimize your losses.