
Relative Strength Index (RSI)
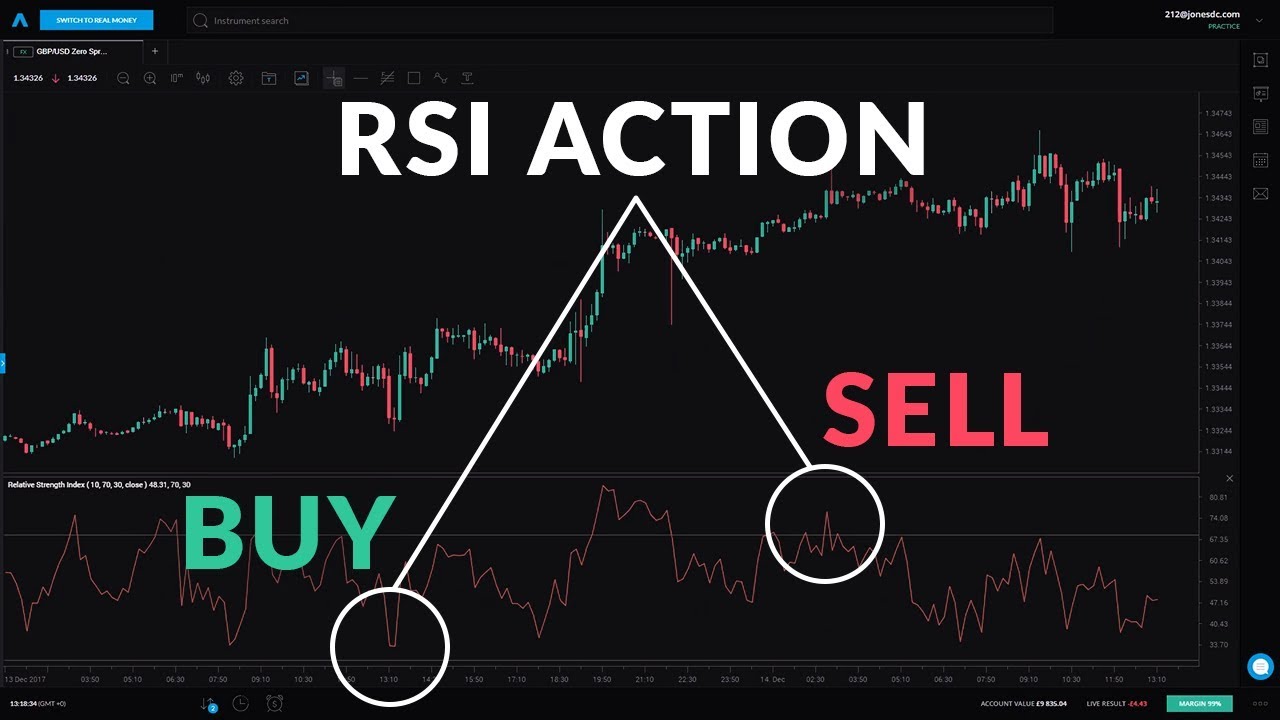
The Relative Strength Index (RSI) is a technical analysis indicator that measures the strength of a security's price action. It is calculated using the following formula:
RSI = 100 - (100 / (1 + RS))
Where RS is the average gain of the security over a specified number of periods divided by the average loss over the same number of periods. The RSI ranges from 0 to 100, with a value of 0 indicating that the security has had no gains over the specified number of periods, and a value of 100 indicating that the security has had no losses over the same number of periods.
Traders may use the RSI to identify overbought and oversold conditions in the market. A security is considered overbought when the RSI is above 70, and oversold when the RSI is below 30. Traders may also look for divergences between the RSI and the price of the security as a potential trade signal. A bullish divergence occurs when the RSI is making new highs while the price of the security is not, and a bearish divergence occurs when the RSI is making new lows while the price of the security is not.
It is important to note that the RSI is a momentum indicator and may not always be reliable in a ranging market. It is often used in conjunction with other technical analysis tools to confirm trade signals and provide a more complete analysis of a security.
Settings for Relative Strength Index (RSI)
The best setting for the Relative Strength Index (RSI) indicator depends on the specific security and trading strategy being used. The RSI is typically calculated using a 14-period time frame, although some traders may use shorter or longer time frames depending on their specific needs.
The RSI has a range of 0 to 100, and it is commonly used to identify overbought and oversold conditions in the market. A security is considered overbought when the RSI is above 70, and oversold when the RSI is below 30. Some traders may use different threshold values for the RSI, such as 80 and 20, or 90 and 10, depending on the volatility of the security.
It is important to note that the RSI is a momentum indicator and may not always be reliable in a ranging market. It is often used in conjunction with other technical analysis tools to confirm trade signals and provide a more complete analysis of a security. There is no "one size fits all" setting for the RSI, and traders may need to experiment with different settings to find the one that works best for their specific security and trading strategy.