
Stochastic Oscillator Indicator
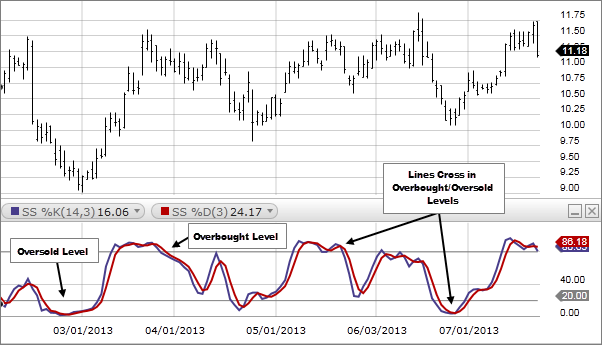
The Stochastic Oscillator is a momentum indicator that is widely used in technical analysis. It compares the closing price of a security to the range of its prices over a certain period of time. The indicator consists of two lines, %K and %D, which oscillate between 0 and 100. The %K line is usually more sensitive and faster than the %D line, which is a moving average of %K.
Traders often use the Stochastic Oscillator to identify overbought and oversold conditions in the market. A reading above 80 is considered overbought, while a reading below 20 is considered oversold. A trader might buy when the %K line crosses above the %D line, indicating a potential trend reversal from bearish to bullish. Alternatively, a trader might sell when the %K line crosses below the %D line, indicating a potential trend reversal from bullish to bearish.
It's important to note that the Stochastic Oscillator is a lagging indicator, meaning that it is based on historical data and may not necessarily be a reliable predictor of future price movements. As with any technical indicator, it is best to use the Stochastic Oscillator in conjunction with other forms of analysis, such as chart patterns, trend lines, and fundamental analysis.
How to use Stochastic Oscillator Indicator
To use the Stochastic Oscillator, follow these steps:
- Choose a time period for the calculation of the indicator. A shorter time period will make the indicator more sensitive, while a longer time period will make it less sensitive.
- Determine the high and low price for the chosen time period.
- Calculate the %K line by taking the current closing price and subtracting the low price for the period, then dividing that result by the high price for the period minus the low price.
- Calculate the %D line by taking a moving average of the %K line. The most common moving average is a 3-day moving average, but other time periods can be used.
- Plot the %K and %D lines on a chart.
- Use the Stochastic Oscillator to identify potential trend reversals. A reading above 80 is considered overbought, while a reading below 20 is considered oversold. A trader might buy when the %K line crosses above the %D line, indicating a potential trend reversal from bearish to bullish. Alternatively, a trader might sell when the %K line crosses below the %D line, indicating a potential trend reversal from bullish to bearish.
It's important to note that the Stochastic Oscillator is a lagging indicator, meaning that it is based on historical data and may not necessarily be a reliable predictor of future price movements. As with any technical indicator, it is best to use the Stochastic Oscillator in conjunction with other forms of analysis, such as chart patterns, trend lines, and fundamental analysis.